Tutorial - World Cities Map
Download Natural Earth Data Populated Places Simple Shapefile: goo.gl/QtJiCn
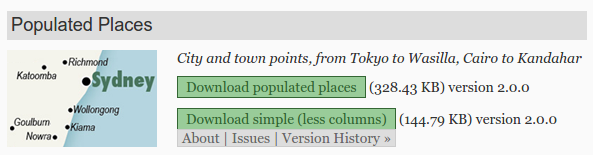
Open cartodb.com and log in
Drag the downloaded ne_50m_populated_places_simple.zip file into your CartoDB Dashboard
Download Natural Earth Data Populated Places Simple Shapefile: goo.gl/QtJiCn
Open cartodb.com and log in
Drag the downloaded ne_50m_populated_places_simple.zip file into your CartoDB Dashboard
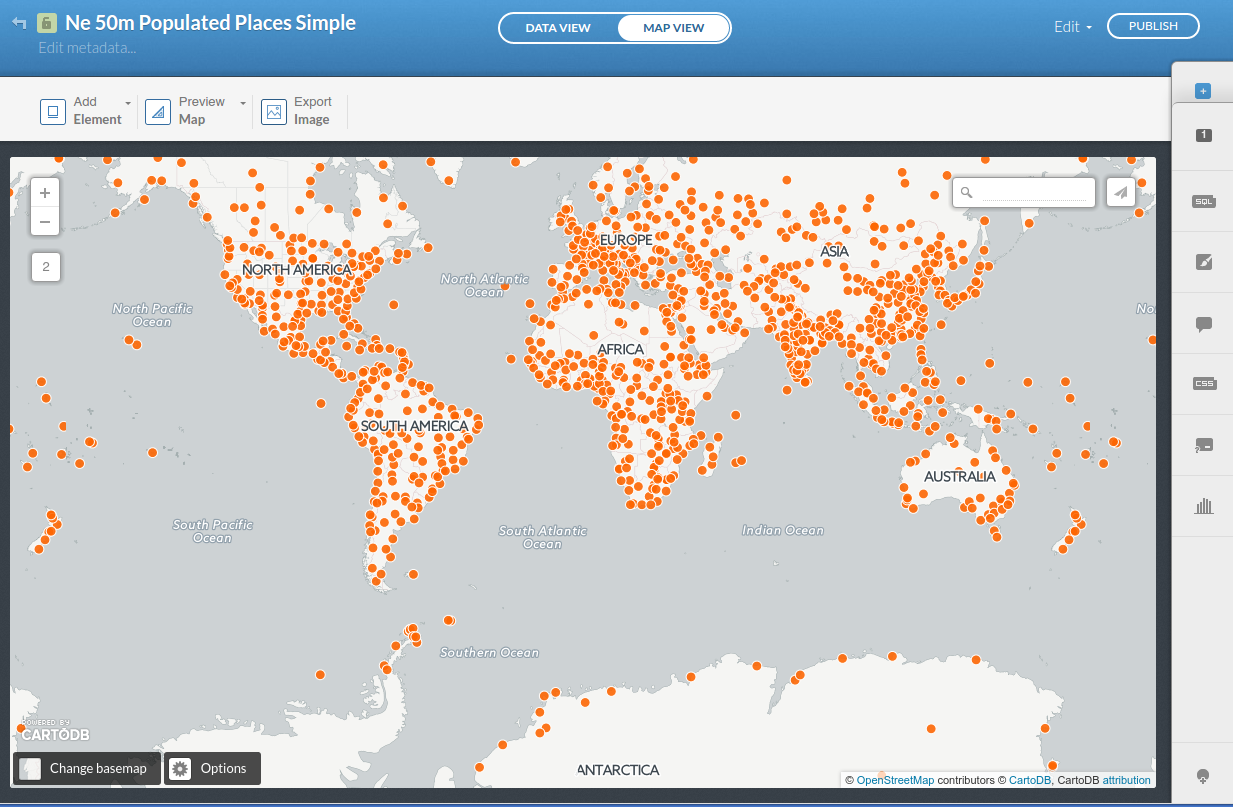
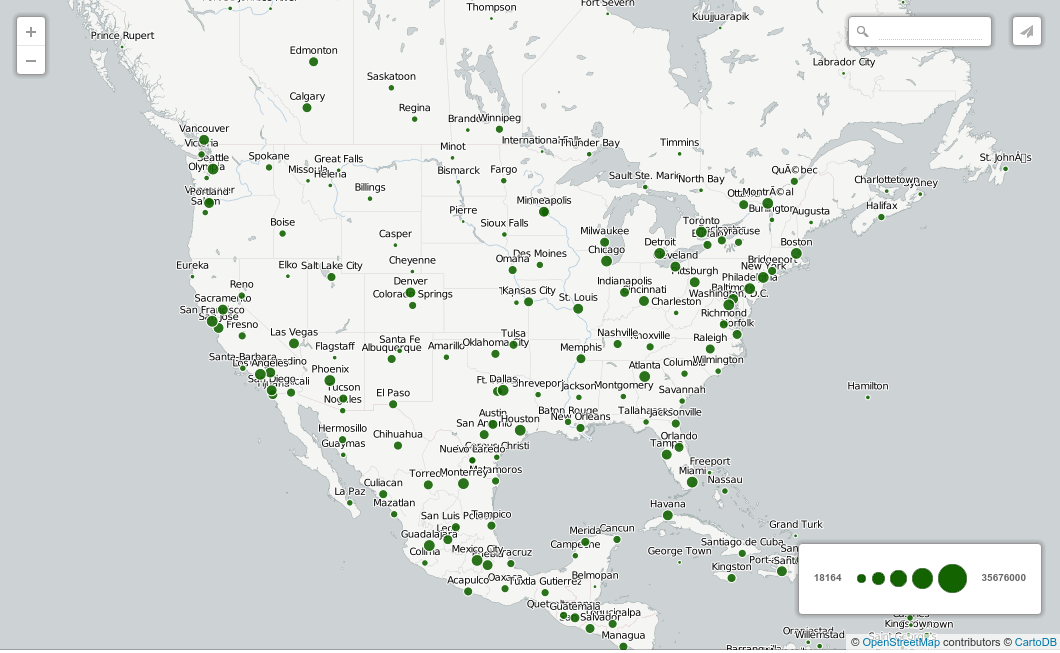
Whoa! A fully functional web map!
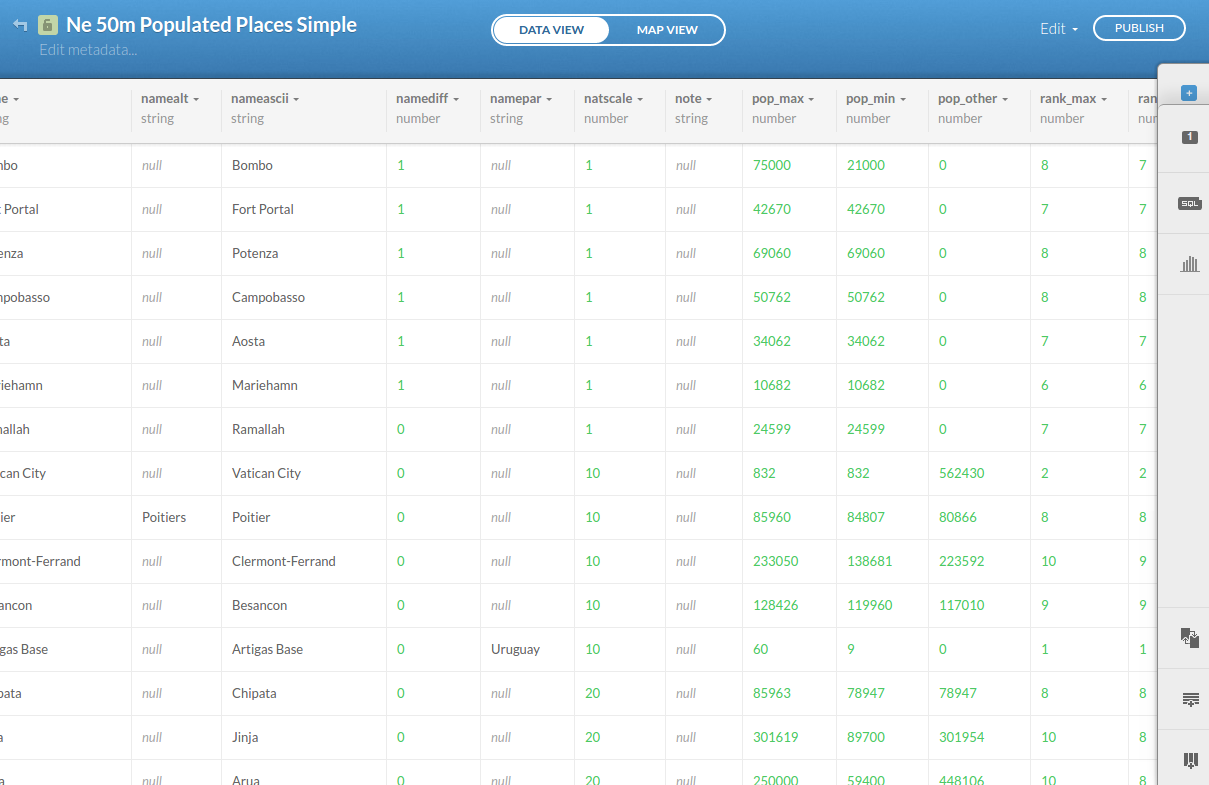
Explore the Data View, note the different columns (especially pop_max)
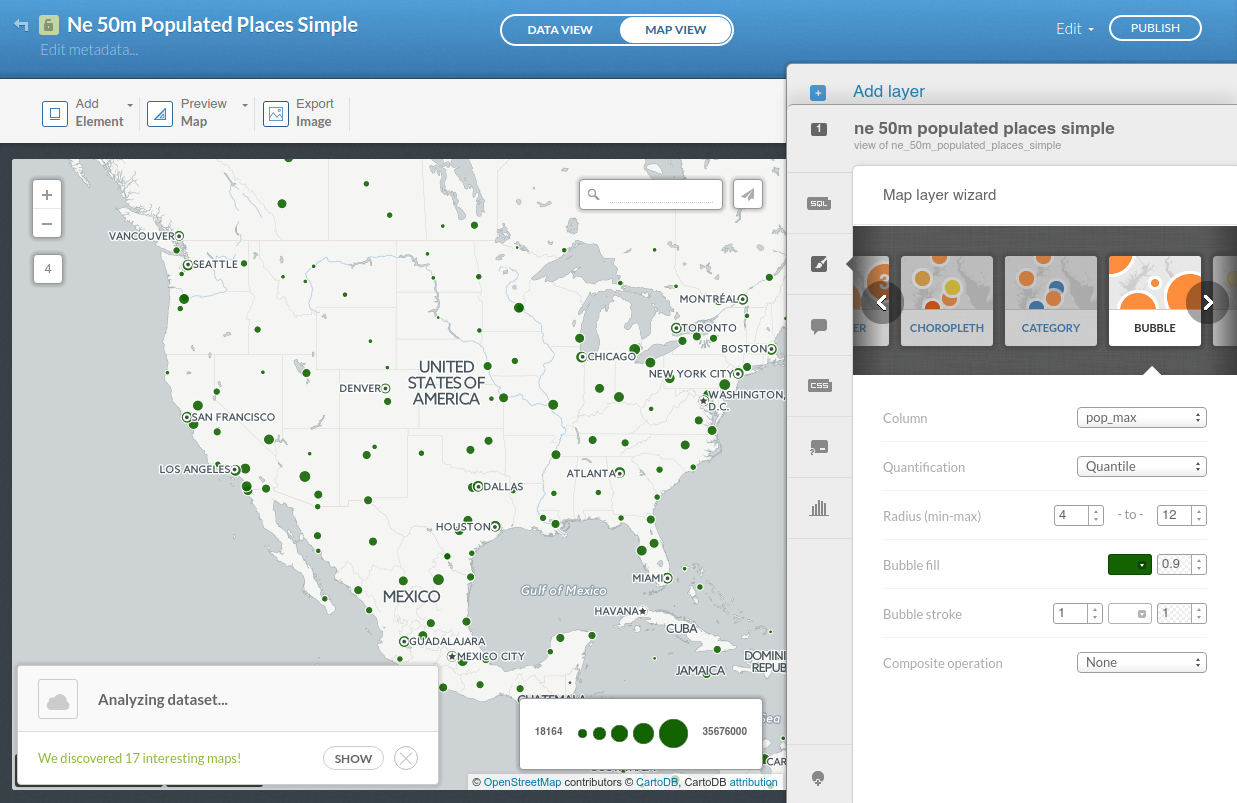
Explore the Map View, experiment with the Wizards.
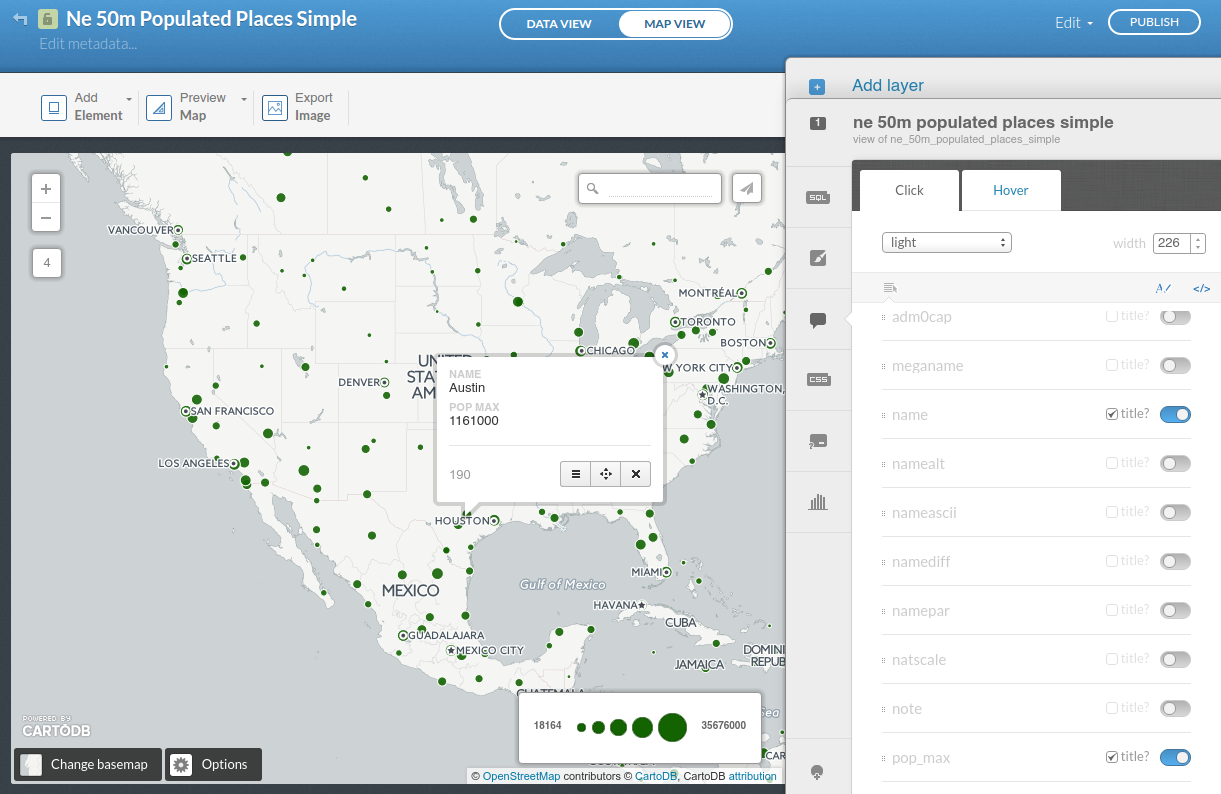
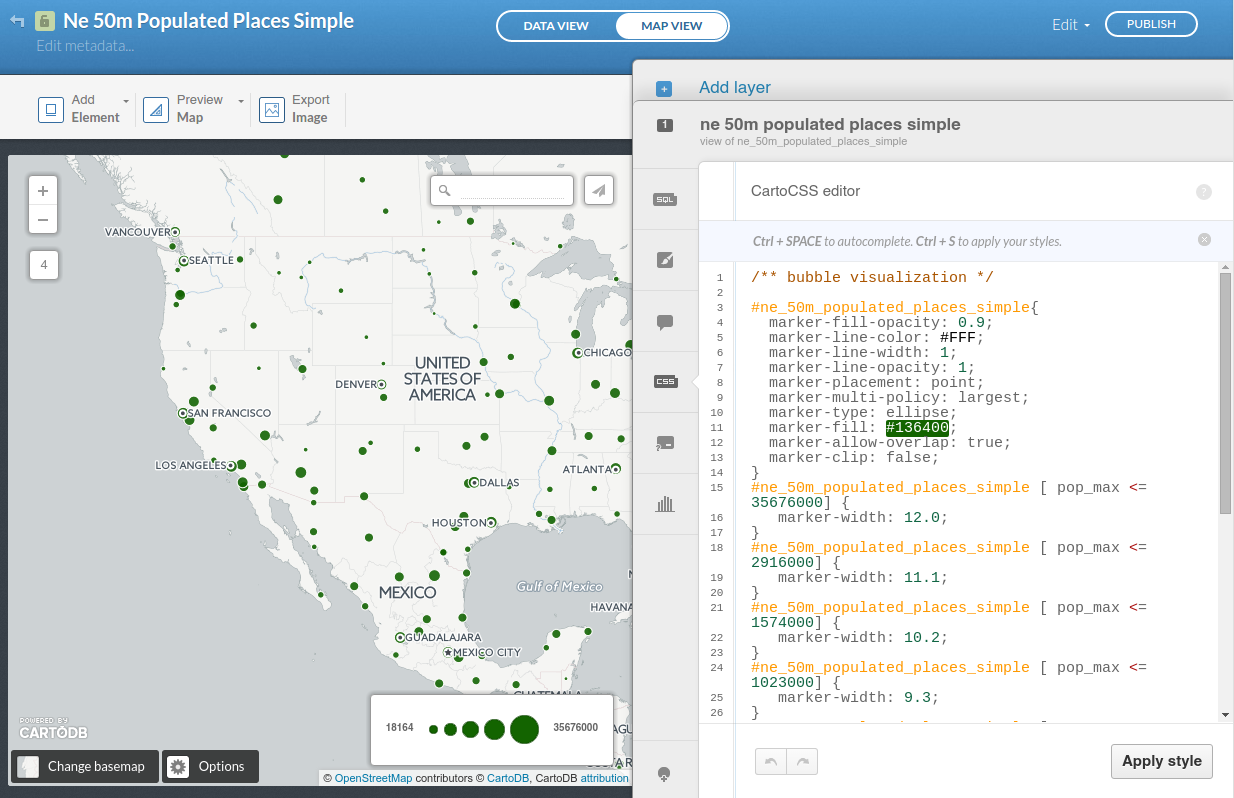
Try making a Bubble Map based on population.
Add an Info Window to display name and pop_max
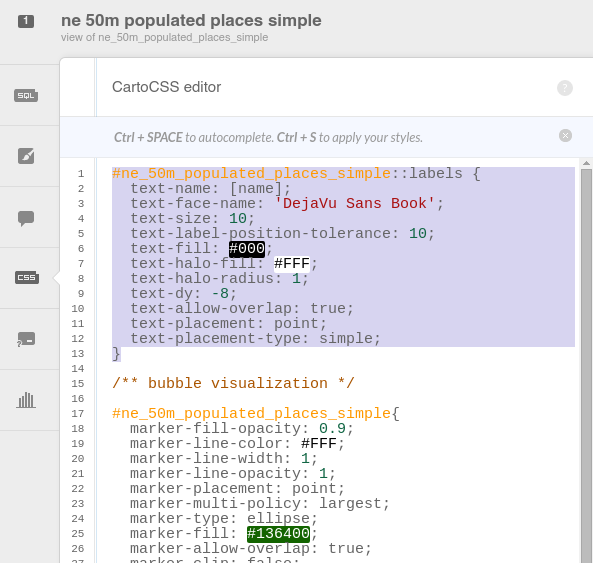
Now that we have labels, let's change the basemap to one without its own labels
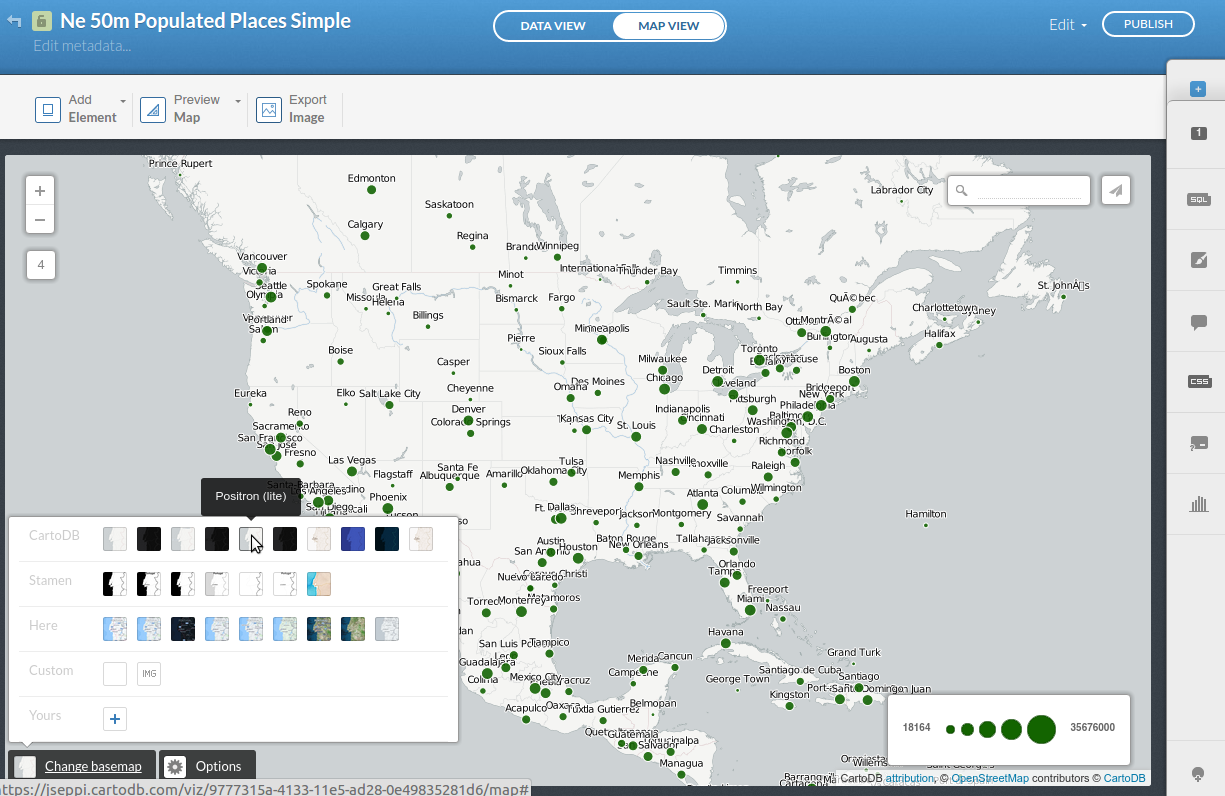
Click Visualize, then Publish to get a shareable link to your map
Nice job!
Introduce yourself to the person next to you and work together for this exercise

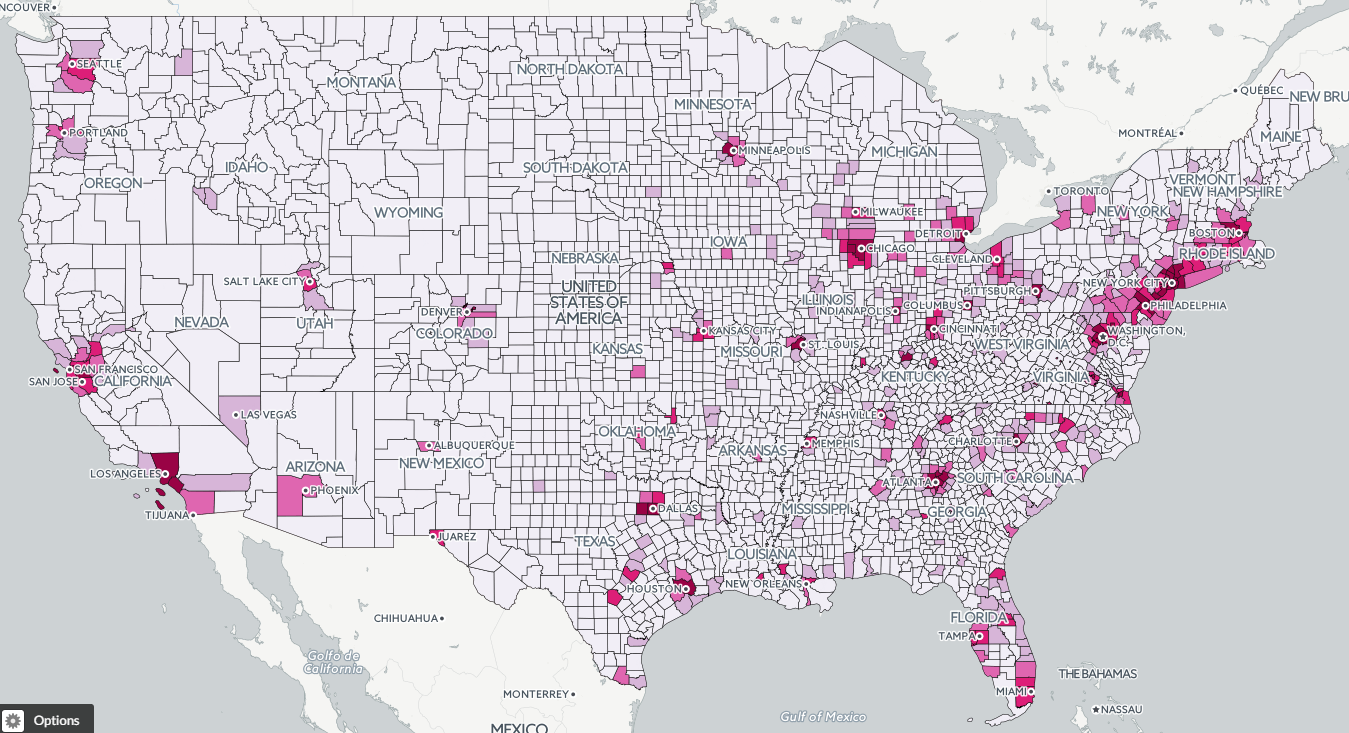
Import the all_month.csv into your CartoDB account (drag and drop)
Experiment with the Wizard tab. Try Heat Map, Intensity, Density, maybe even Torque.
Example: cdb.io/1JUy0WP
Thanks to all of you for coming!

Thanks to ObjectRocket for hosting and CartoDB for the pizza!
Learn more about CartoDB at the CartoDB Map Academy